This interactive Ishihara-style test generates 20 randomized dot plates to evaluate how well you distinguish red and green hues. The tool adapts plate difficulty in real time, tracks your accuracy and response speed, and summarizes performance with clear metrics and visuals—right in your browser.
Ishihara Red-Green Color Discrimination Test
This test evaluates your ability to distinguish red-green colours using Ishihara-style plates.
Test Instructions
- Look at the circle and identify the number formed by the coloured dots
- Type the number you see in the input field and click Submit
- If you cannot see a number, you can click Skip
- The test adapts to your ability. It becomes harder with correct answers
- Complete all 20 plates for a comprehensive assessment
- Ensure proper lighting and disable any colour-enhancing or colour-adjusting features on your screen
- The test measures your response time for each plate
Test Results
How to Use the Test
- Prepare your screen: Turn off Night Shift, blue-light filters, or any “warm” color modes. Keep brightness moderate.
- Set your environment: Use neutral room lighting, avoid glare, and sit about arm’s length from the display.
- Check zoom: Keep the browser at 100% so plates are rendered at the intended size.
- Start: Click “Start Test” to begin the sequence of plates.
- Respond: Type the number you see in the circle. If none is visible, click “Skip.”
- Complete all 20 plates: The difficulty automatically adjusts based on your answers.
- Review results: At the end, you’ll get your score, the highest difficulty you reached, and detailed feedback (for free, no e-mail, no registration).
Features of The Test
- 20 adaptive Ishihara-style plates per session
- Seven difficulty levels: Very Easy to Extreme
- Real-time adaptive staircase that adjusts difficulty with every answer
- Extreme mode with micro-refinements in hue and saturation
- Procedurally generated dot fields and embedded shapes (no repeats)
- Randomized numbers between 1 and 99
- Per-plate response time tracking
- Instant feedback after each submission
- Skip option for uncertain answers
- Live progress bar and score counter
- Difficulty indicator with labels and dot markers
- Performance analysis by difficulty level
- Mastery percentage calculation
- Final results with score, accuracy, median response time
- Headline interpretation based on smallest resolved hue difference
- Detailed results with color swatches and plate metadata
- Tailored performance summary and estimated threshold
- Data quality checks (fast/slow responses, low accuracy, few trials)
- Responsive interface for desktop, tablet, and mobile
- Restart button to instantly retake the test
Why It Works for Color Blindness Recognition
The test challenges the L–M cone pathway of the eye, which is where red–green deficiencies (protan and deutan types) occur. By presenting numbers hidden in randomized dot fields and progressively narrowing the hue difference (Δh) between red and green, it stresses the very contrast most affected by red–green color vision anomalies.
The adaptive staircase ensures each user is pushed toward their perceptual threshold, while randomized plate generation prevents reliance on memory. This makes the tool effective at highlighting typical recognition patterns seen in individuals with and without red–green color blindness.
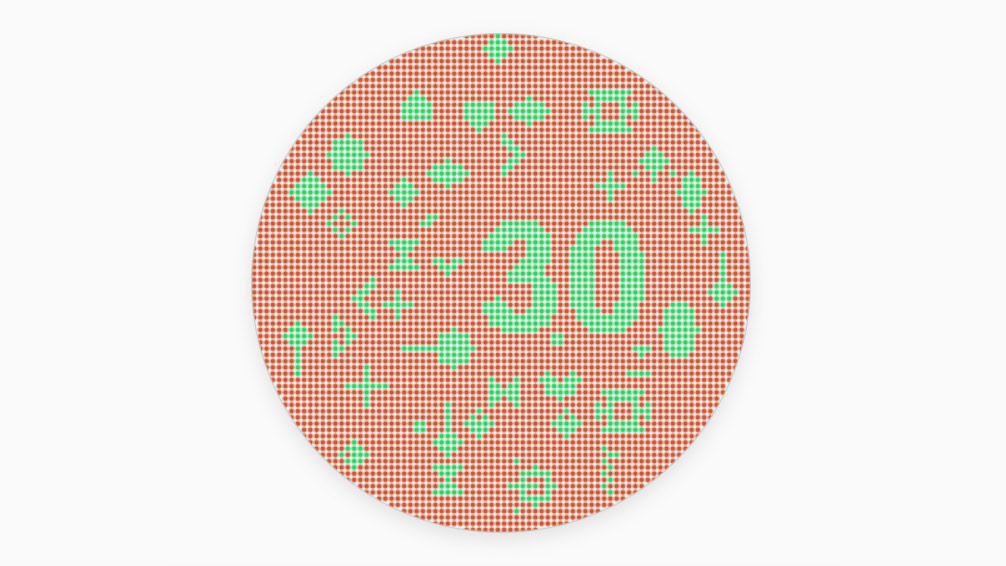
Number 30 plate from the test
Frequently Asked Questions
Why are Ishihara plates effective for detecting red–green color blindness?
Ishihara plates exploit the fact that people with protan (L-cone deficiency) or deutan (M-cone deficiency) have reduced sensitivity to differences along the red–green axis of color space.
By embedding numbers in dot patterns where only chromatic contrast (ΔL/ΔM signals) defines the figure, and luminance cues are minimized, these plates selectively stress the pathways most affected by red–green color vision deficiency.
How does this test differ from clinical Ishihara books?
Clinical Ishihara plates are printed with precisely calibrated inks to control spectral reflectance under standardized lighting (usually CIE Standard Illuminant C). Online tests, while useful for screening, depend on display gamut, gamma, and calibration. The algorithm here reproduces the principle—randomized pseudo-isochromatic dots with controlled Δh along the red–green axis—but the absolute colorimetry cannot be standardized across devices.
Why does this tool use an adaptive staircase rather than fixed plates?
In psychophysics, adaptive staircases (e.g., 2-up/1-down or 3-up/1-down rules) efficiently converge toward an observer’s threshold—often around 70–80% correct—by dynamically adjusting difficulty. This avoids wasted trials that are too easy or too hard, and yields a finer-grained estimate of the minimum hue separation (Δh) a user can resolve.
Can this type of test detect tritan (blue–yellow) deficiencies?
No. Ishihara plates and red–green adaptive tests target the L–M pathway. Tritan defects involve the S-cone system (blue–yellow axis) and require specialized stimuli designed to vary along S/(L+M).
Tools like the HRR plates or Farnsworth D-15 test are more appropriate for assessing tritanomaly or tritanopia.
What does a “Δh threshold” represent scientifically?
Δh refers to the hue angle difference in color space (here approximated with HSL/HSV, but clinically measured in CIE L*a*b* or LMS cone coordinates).
The smaller the Δh that an observer can reliably discriminate, the finer their chromatic resolution along that axis. For typical trichromats, thresholds are only a few degrees, while red–green deficient observers may require much larger Δh values.
References
- Bento-Torres et al. (2016), *Psychophysical Evaluation of Congenital Colour Vision Deficiencies* – shows that protan and deutan individuals have reduced color discrimination thresholds along the red–green axis, particularly when assessed using Farnsworth–Munsell and Mollon–Reffin paradigms.
- Wikipedia – *Ishihara test* overview – the classic pseudoisochromatic plates embed numbers in dot patterns designed to be visible only to observers with normal red–green color discrimination, forming the basis for modern screening tools.
- Fanlo-Zarazaga et al. (2024), *Validation of a New Digital and Automated Color Perception Test* – compares digital, automated tests across red, green, and blue discrimination axes with traditional Ishihara and Farnsworth–Munsell tests, underscoring the emerging validity of screen-based color-vision testing.
What are your results in this test? Would you like to see any more features in it? Let us know in the comments!
CalcuLife.com
")

")


Leave A Comment